
Visualization of Flood, Disease and Climate Modeling through the Eclipse Path of Texas and Beyond
Outreach ·For the April 8 total solar eclipse, the Oden Institute for Computational Engineering and Sciences featured the installation “From COASTLINE to INLINE,” which integrates arts and technology at the intersection of climate change, flood and disease modeling.
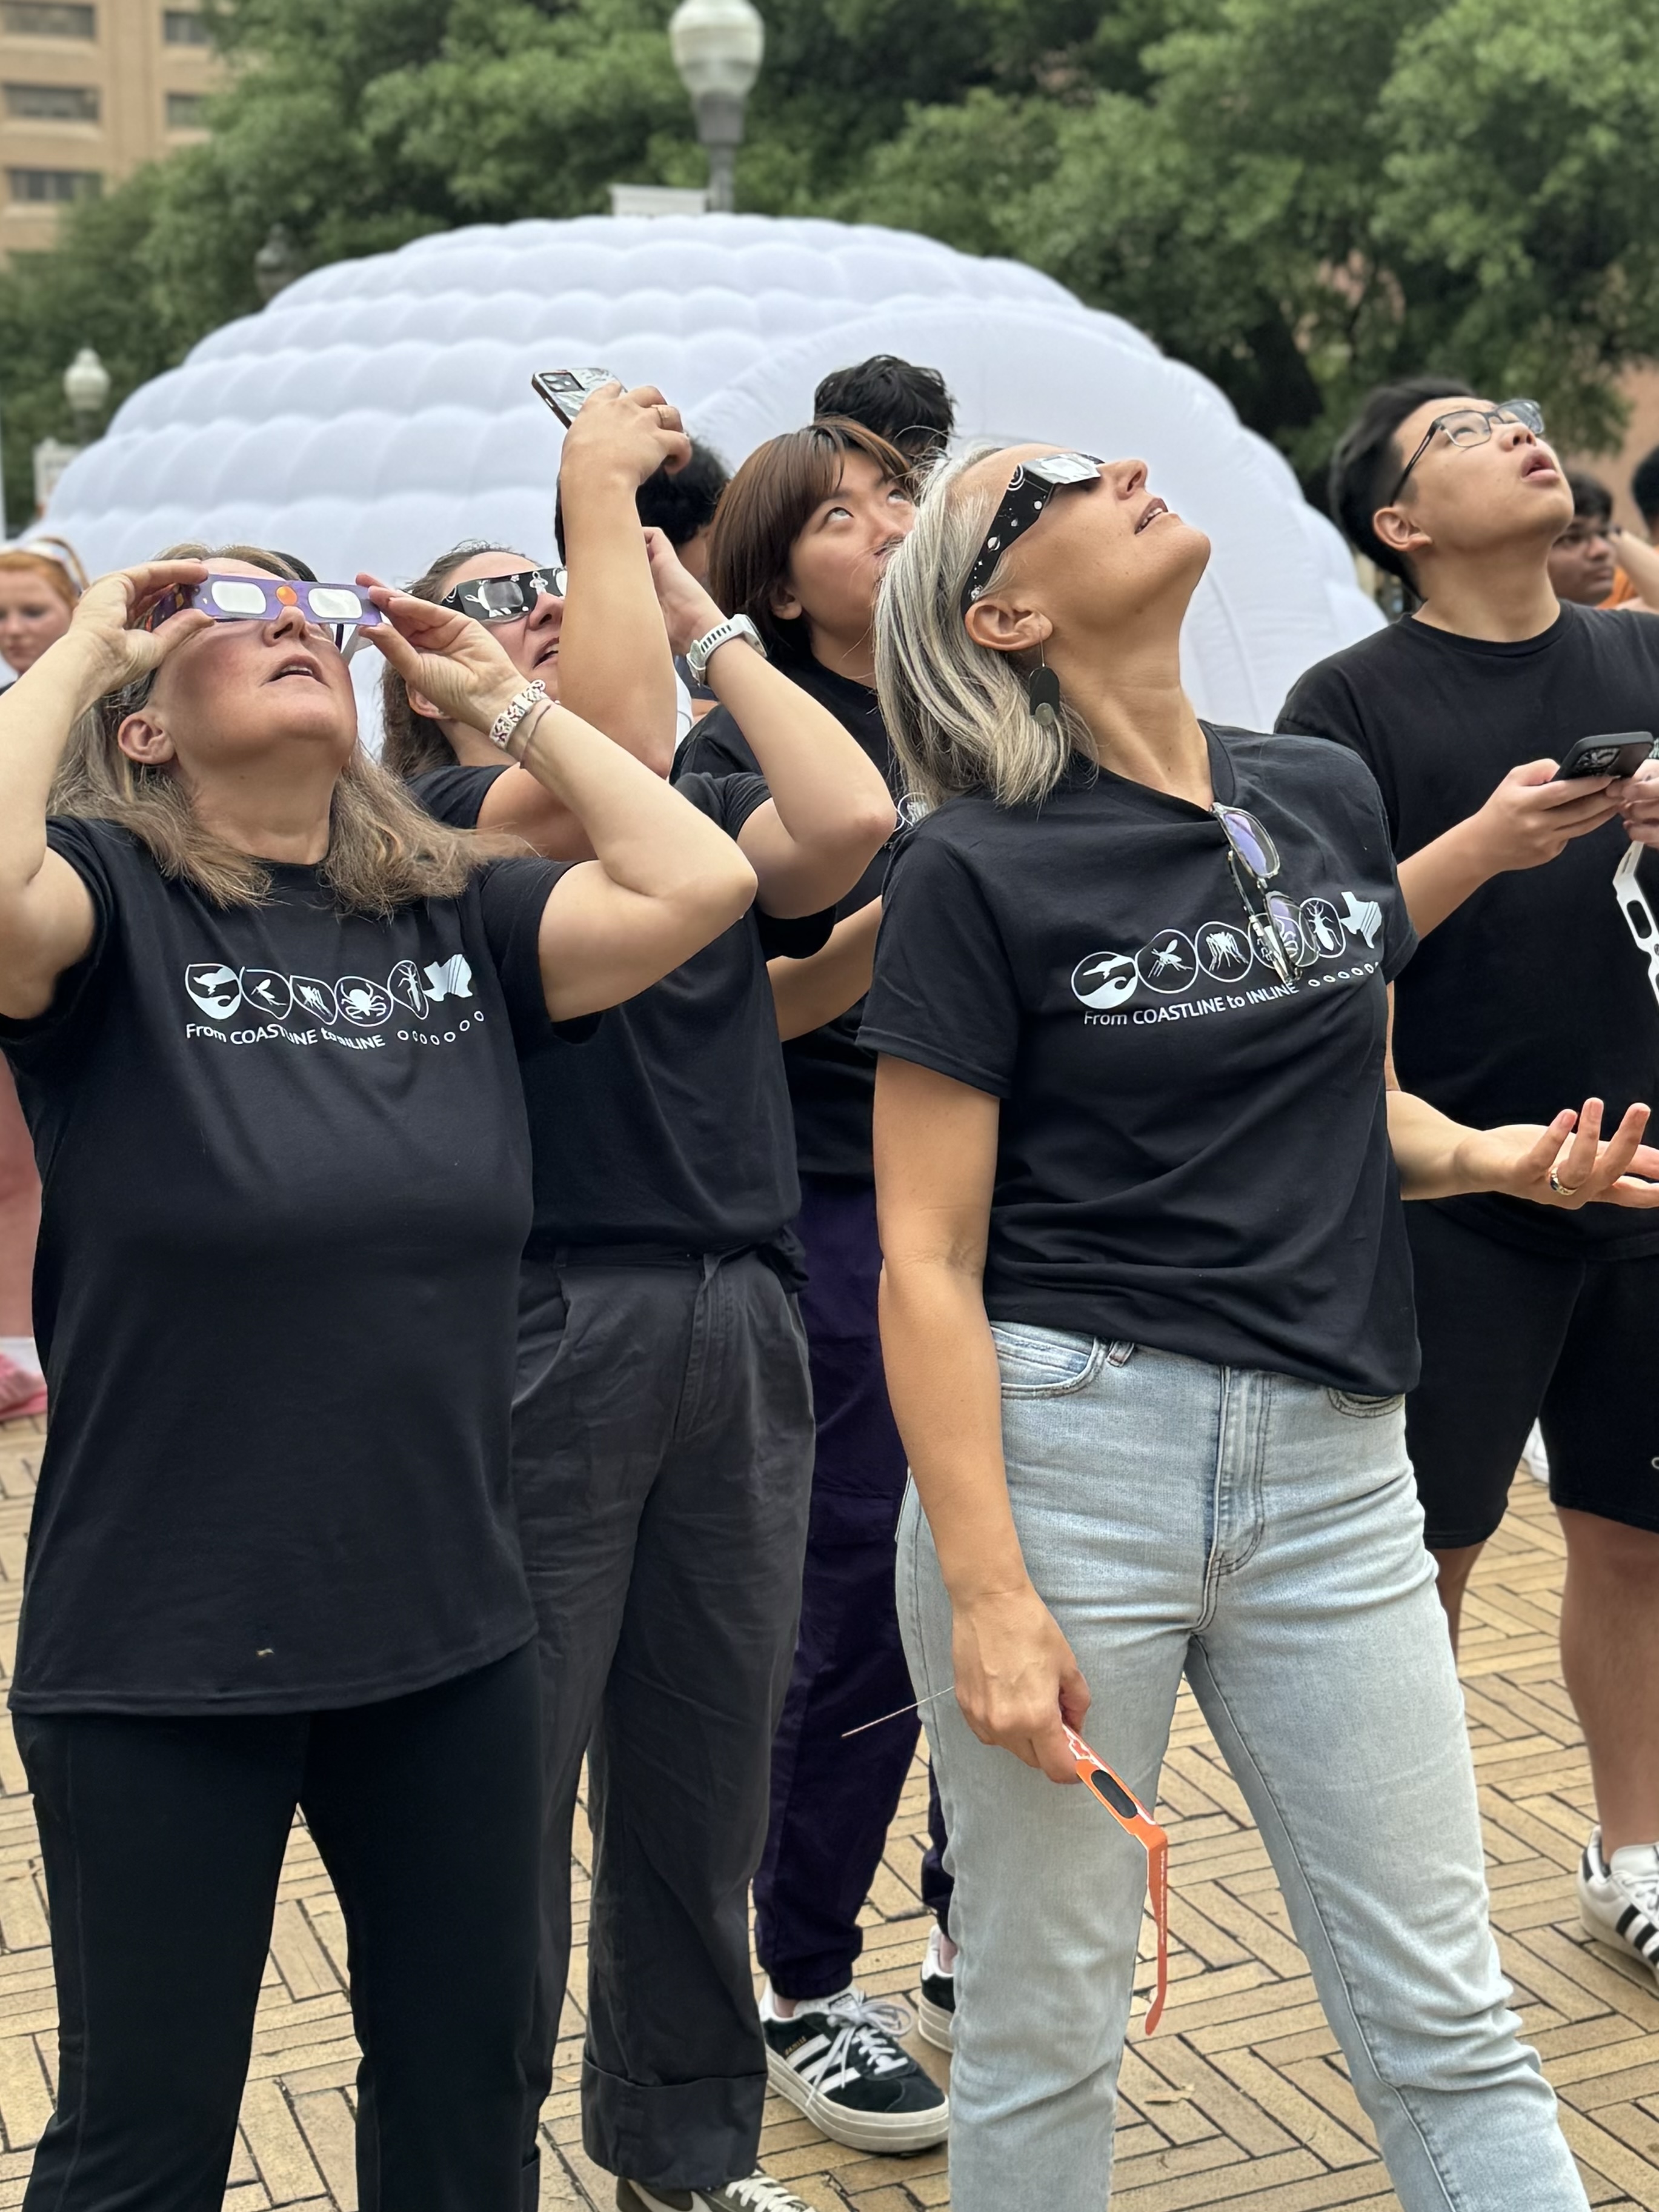
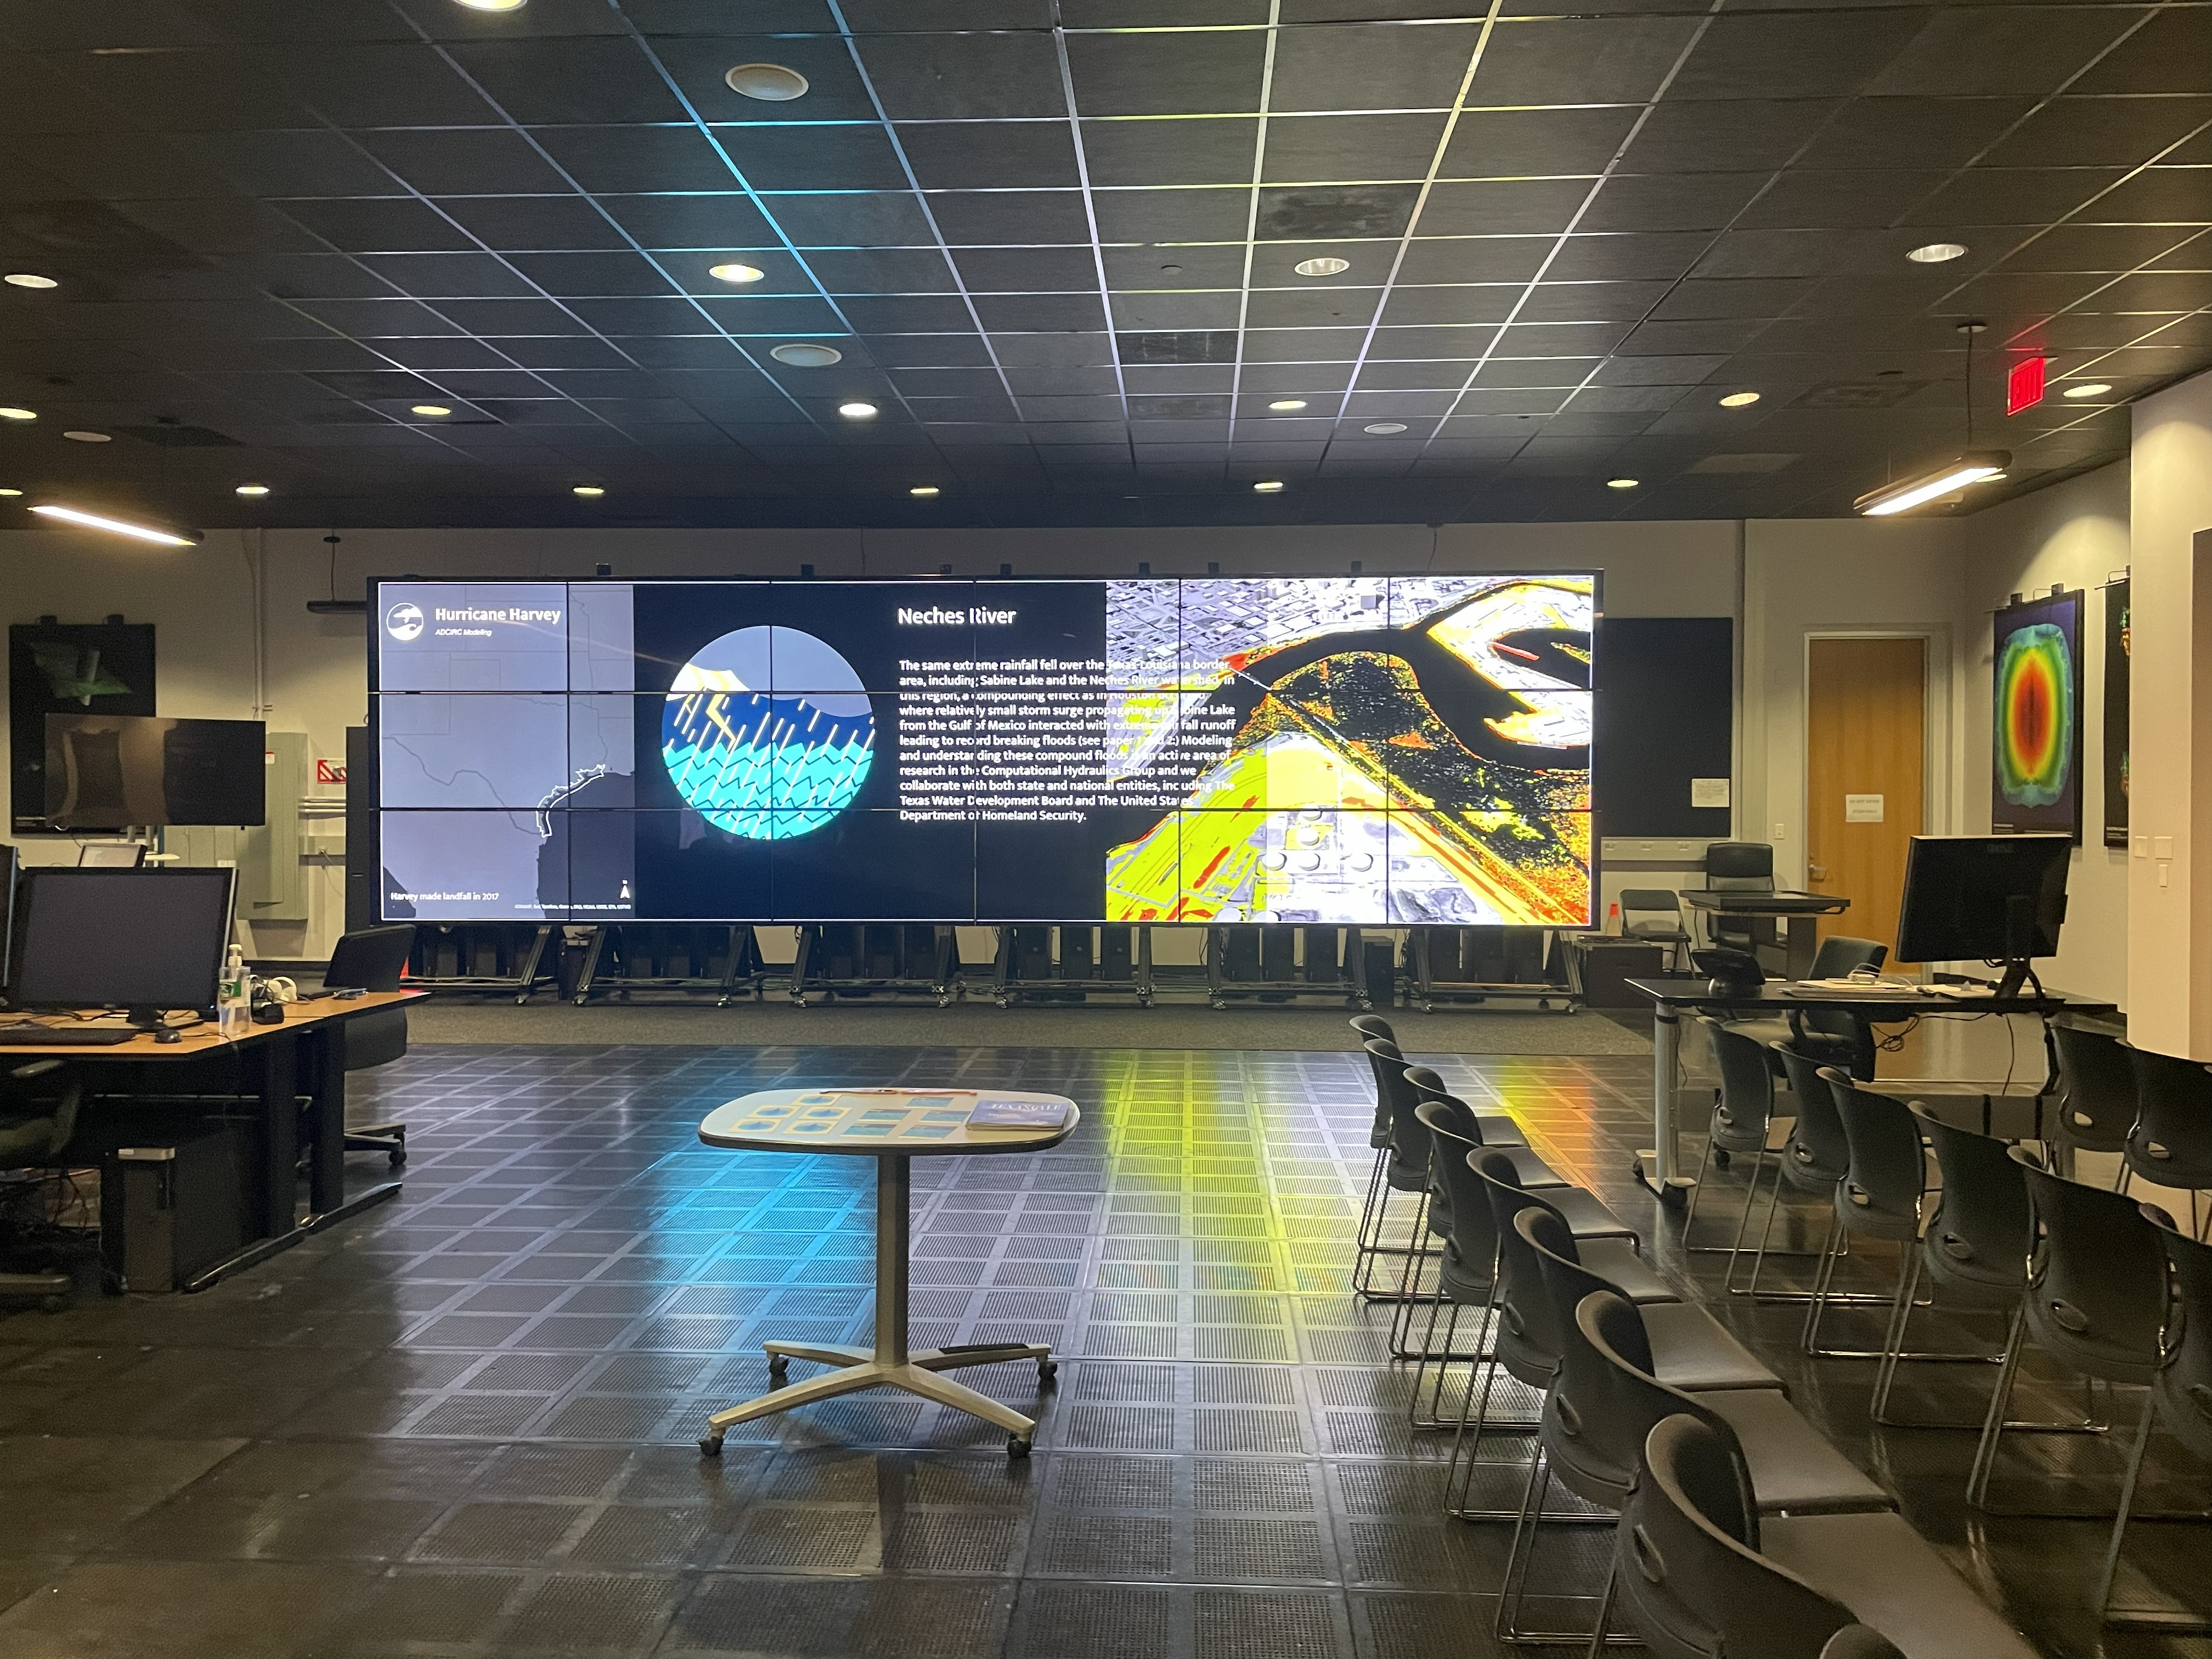
The 3D installation featured models and maps from the Texas coastline to the eclipse path of totality, showcasing modeling research aimed at understanding how climate change and extreme weather events influence the distribution of organisms that may cause emerging diseases. The visualization was open to the public at the Texas Advanced Computing Center (TACC) Visualization Lab (VisLab) on the main campus, located on the main floor of the Peter O’Donnell, Jr. Building (POB) on April 8 from 10am – 4pm.
Featured on a massive wall of interconnected screens using the National Ocean and Atmospheric Administration eclipse simulation path as the area of focus, the visualization highlighted various sources of data (citizen science, fieldwork observations, and monitoring) that are used in this research. Computational models were visualized to illustrate how flooding and climate can influence habitats for organisms that can spread emerging infectious diseases in Texas.
“The visualization features imagery of insects that become more prevalent further inland as a result of climate-related events, including the kissing bug, sand fly, lone star tick, and yellow fever mosquito, and a marine bacterial pathogen vibrio vulnificus,” explained Katherine Brown, a senior research fellow with the Computational Hydraulics Group at the Oden Institute. “These insects and pathogens bring a greater risk to humans who come in contact with them after a weather event, bringing the potential for more disease.”
“By emphasizing each of these insects and their location along the path of the solar eclipse we hope to bring attention to our research using visualization as an accessible tool for communicating,” Brown said.
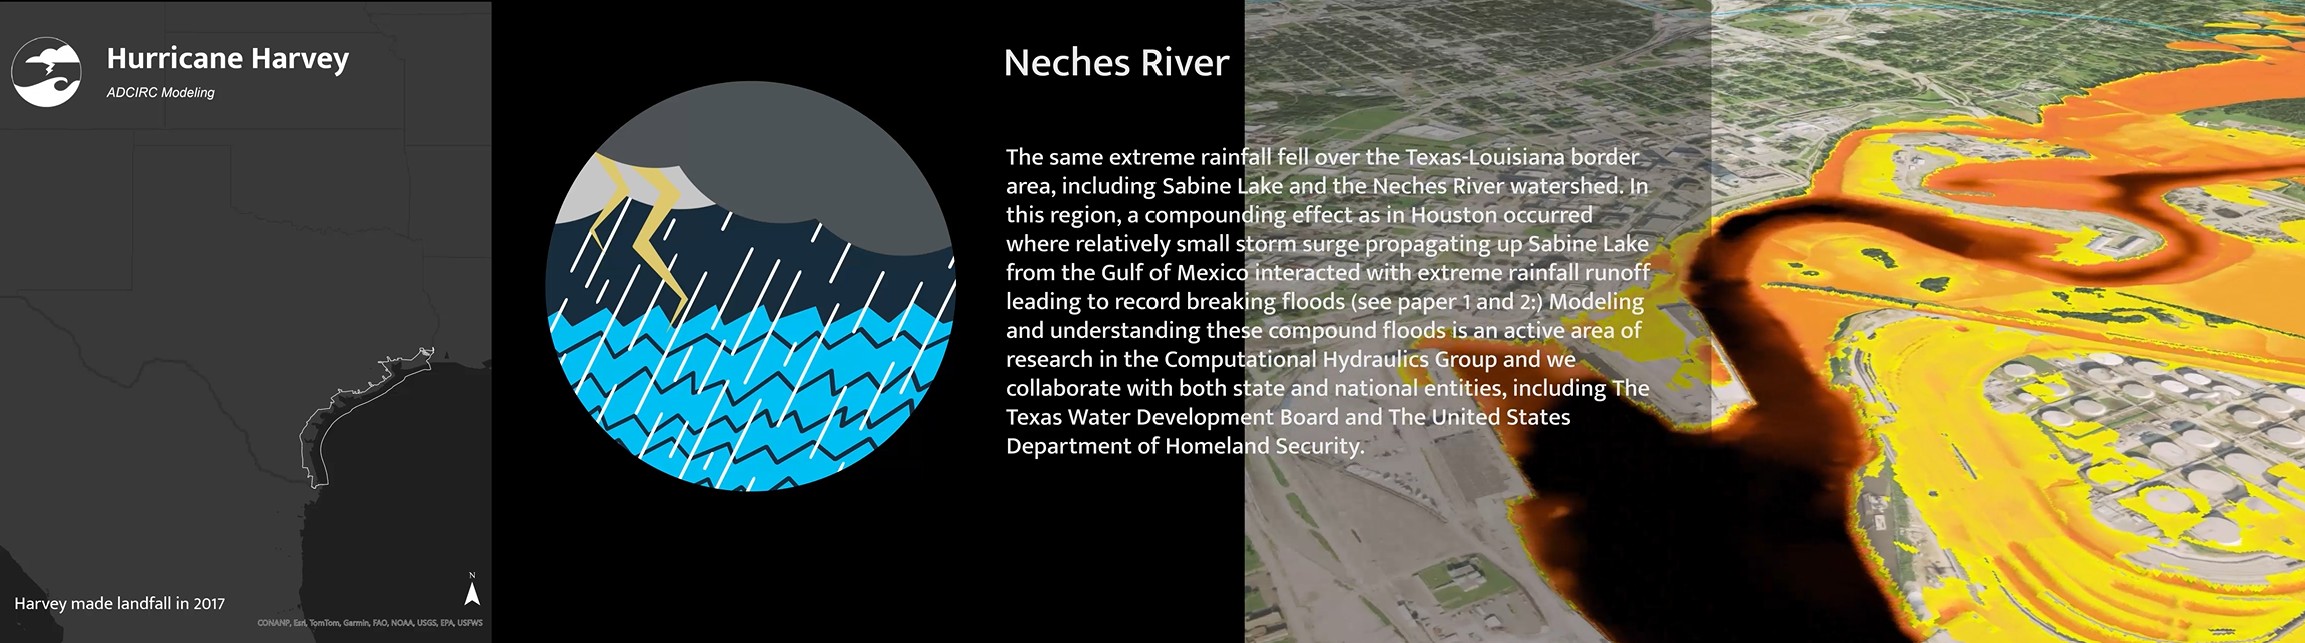
Maps similar to those employed in this visualization are used as predictive tools and help provide new insights about the potential spread of neglected tropical diseases beyond the tropics. A key focus of this work is to integrate various modeling approaches to understand the influence of climate-related events on the environment that can influence the distribution and proliferation of pathogenic organisms present in the soil and water.
In addition to Brown, the display was piloted by Madison Russ and Juliet Whitsett. The visualization installation was supported by Planet Texas 2050, the Wellcome Trust and the Oden Institute for Computational Engineering and Sciences.
Read the full article on UT Austin News.