FloDisMod Multi-Agent System (MAS) Architecture
Based on: Zhao, Cerrone, Westerink & Dawson — Towards Multi-Agent Autonomous Reasoning in Hydrodynamics, arXiv:2605.01102 (2026)
Notional Layer Execution Graph (LEG)
💬 Natural-language query
→
🗺️ Graph Architect
→
constructs LEG from routing heuristics & specialist registry
Layer 1 — Hydrological specialists (parallel)
Layer 2 — Ecological & disease specialists (parallel)
↓
🗺️ Probabilistic risk maps
💬 Conversational insights
🚨 Early warning alerts
📂 Open datasets
Specialist Agent Registry
Hydrological Data
NHC
storm tracks
advisories
advisories
STOFS
surge forecasts
flood extent
flood extent
NOAA CO-OPS
water levels
tide gauges
tide gauges
USGS
high-water marks
streamflow
streamflow
FEMA
flood zones
NFHL
NFHL
OSM / Image
basemaps
visual context
visual context
Ecological / Environmental
Climate
temp · humidity
SST · rainfall
SST · rainfall
Land Cover
vegetation
urban extent
urban extent
Terrain / Bathy
DEM · LiDAR
standing water
standing water
Vector Habitat
breeding sites
niche detection
niche detection
Sea Surface
SST · salinity
coastal plumes
coastal plumes
Disease Specialists
Dengue
Aedes habitat
PDE mosquito sim
surveillance
PDE mosquito sim
surveillance
Vibrio
SST · salinity risk
coastal water quality
STOFS-linked
coastal water quality
STOFS-linked
Screwworm
Cochliomyia habitat
livestock exposure
agricultural data
livestock exposure
agricultural data
Figure.
Top: a notional Layer Execution Graph (LEG) for a representative query.
The Graph Architect receives a natural-language query, consults the specialist registry, and constructs a query-specific LEG.
Colored boxes in the LEG represent unnamed specialist agents drawn from the registry; colors correspond to agent type.
A consolidator fuses parallel outputs between layers; the reporter synthesizes the final response with full provenance logging.
Bottom: the full specialist registry from which the Graph Architect selects agents for any given LEG.
Hydrological agents (blue) connect to NHC, STOFS, NOAA CO-OPS, USGS, FEMA, and OSM for flood and storm data.
Ecological agents (green) supply climate forcing, terrain, land cover, vector habitat, and sea-surface conditions that define transient ecological niches.
Disease specialist agents handle Dengue (Aedes habitat model; PDE-based mosquito simulation validated against Hurricane Harvey trap counts),
Vibrio (sea-surface temperature and salinity risk linked to STOFS operational output), and
Screwworm myiasis (Cochliomyia hominivorax habitat and agricultural exposure data).
Forecasting of Climate-Sensitive Mosquito Distributions to Evaluate Vector-Borne Disease Risk
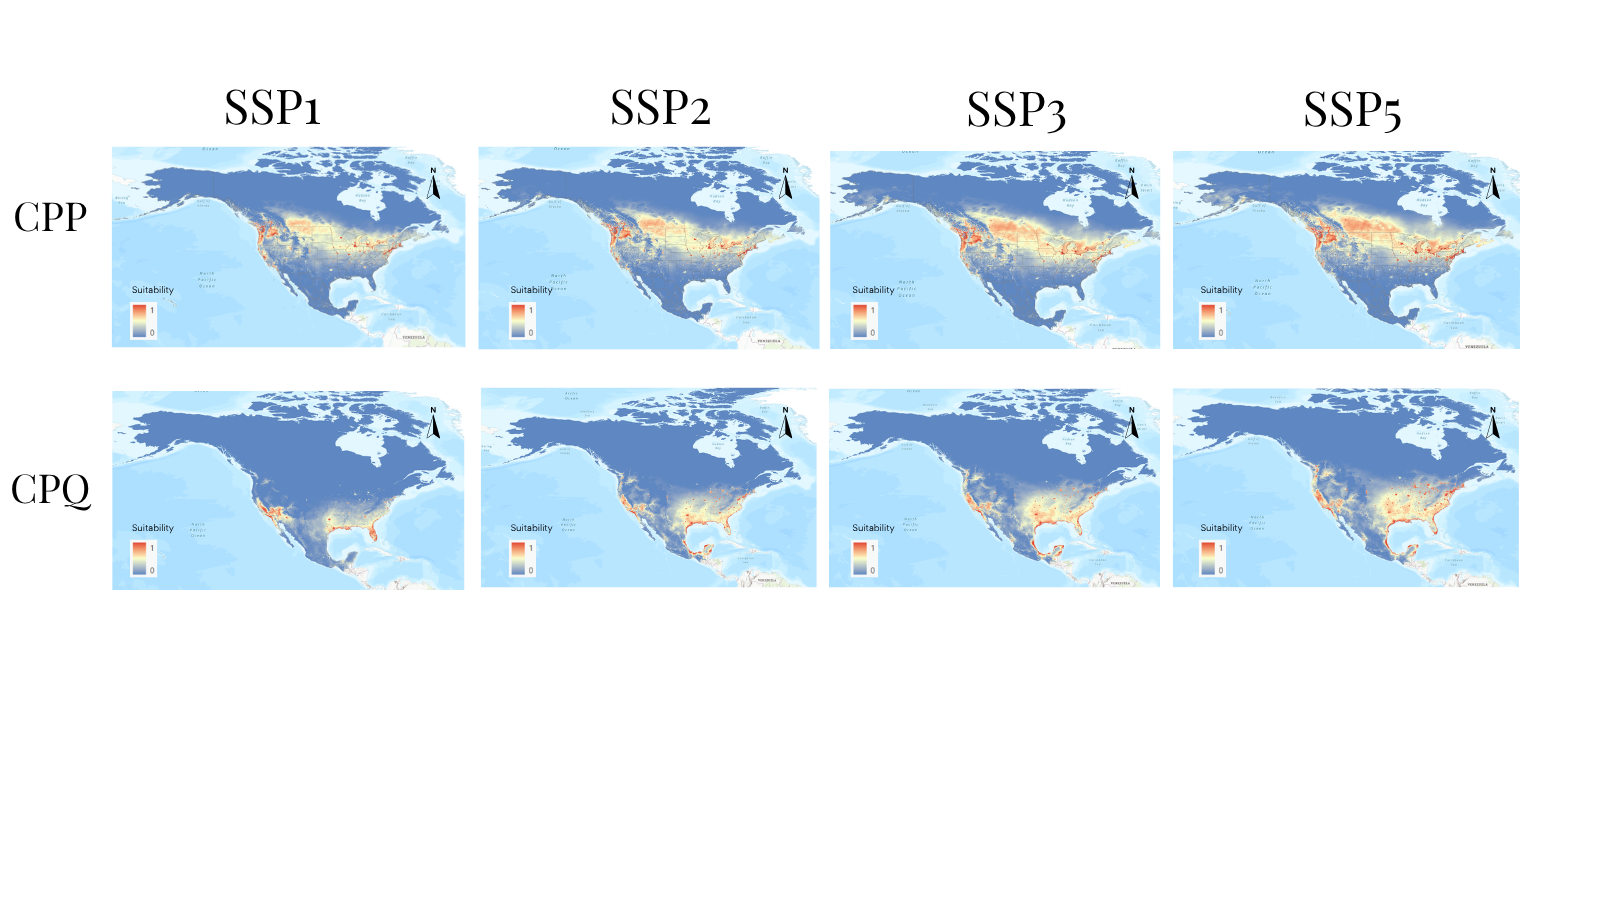
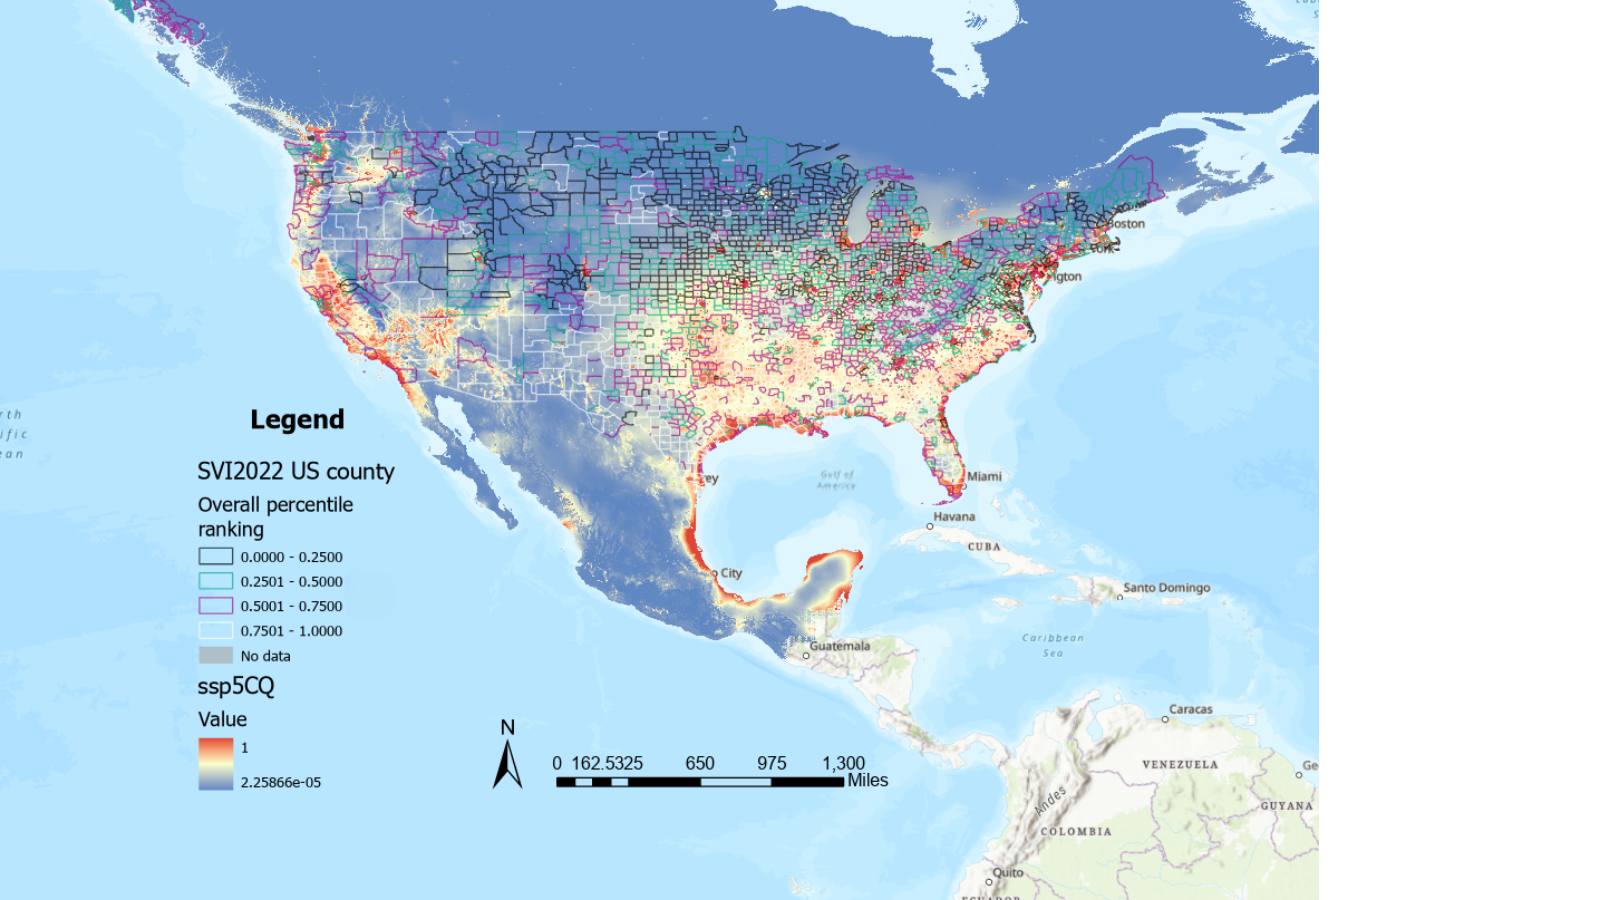
The increased occurrence of extreme weather events is reshaping the distribution of disease vectors, increasing the risk of emerging diseases and expanding the transmission zones for pathogens such as West Nile virus (WNV). Initially, focusing on North America, we are developing a scalable framework to model and forecast the distribution of key mosquito vectors, known to be responsible for the transmission of WNV. By integrating hydrological and ecological niche modeling, landscape description and climate projections, we generate interpretable predictions of current and future habitat suitability of mosquito species. To complement this framework, initially, we explicitly focus on *Culex pipiens pipiens* and *Culex pipiens quinquefasciatus*, two closely related, often hybridizing mosquito species. They are major vectors for WNV in North America: *C. p. pipiens* is generally found in temperate, higher-latitude regions and *C. p. quinquefasciatus* is dominant in tropical and subtropical regions. Figure 1 shows the occurrence map of *C. p. pipiens* and *C. p. quinquefasciatus* mosquito species in North America between 2020–2025. In total, 4981 occurrence records were identified.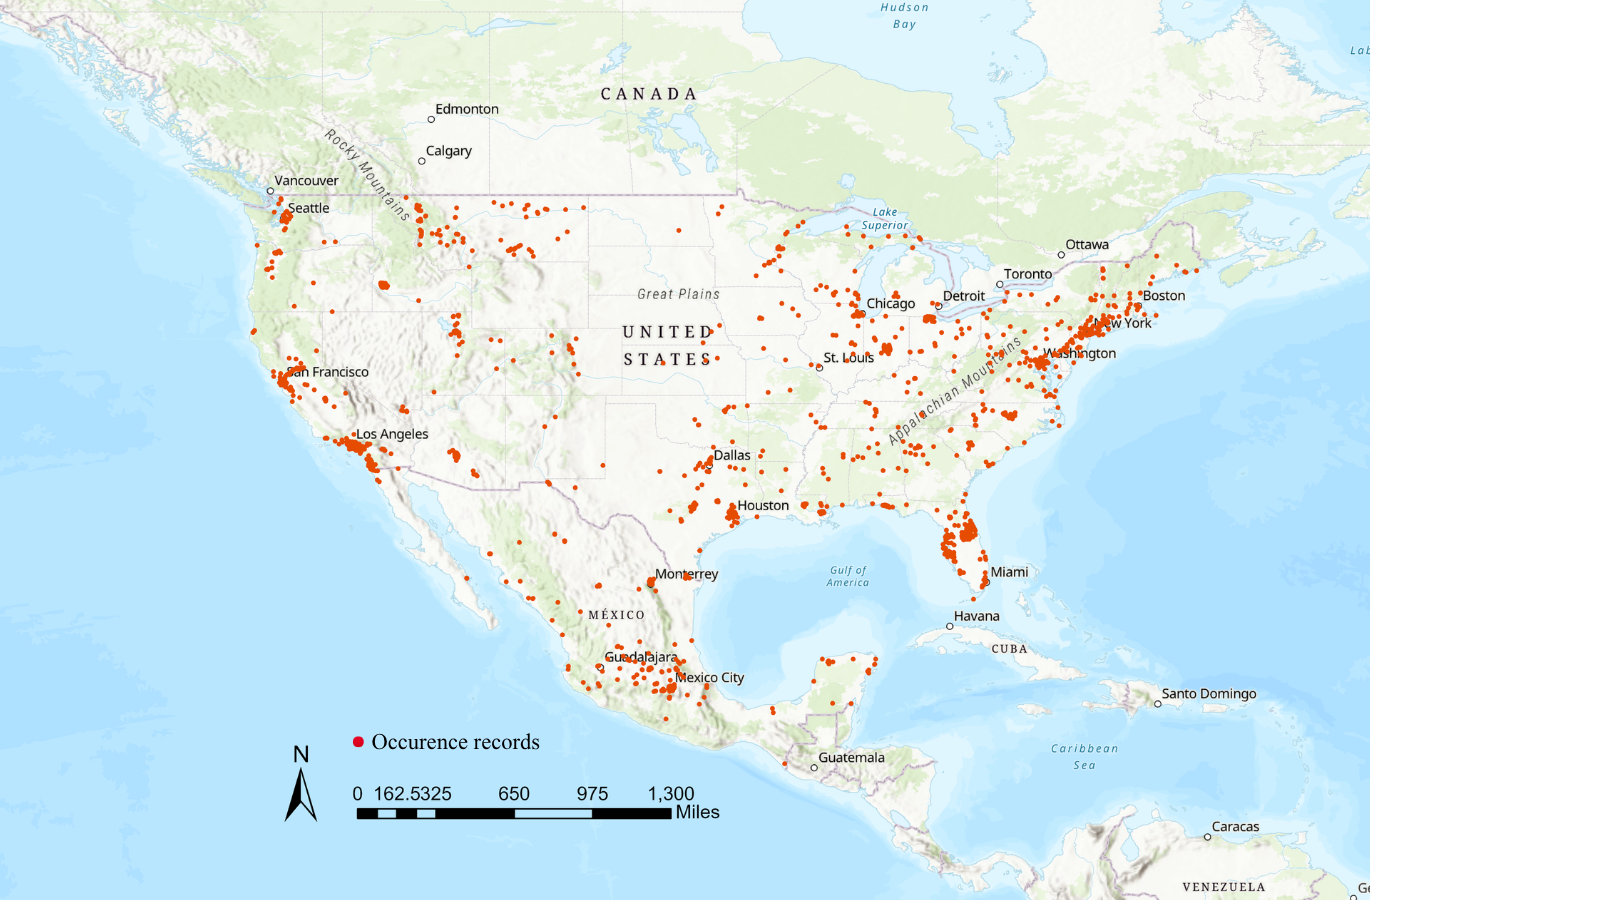
Tracking the Hidden Spread: Predicting Chagas Disease Risk Through Triatomine Habitat Models in North America
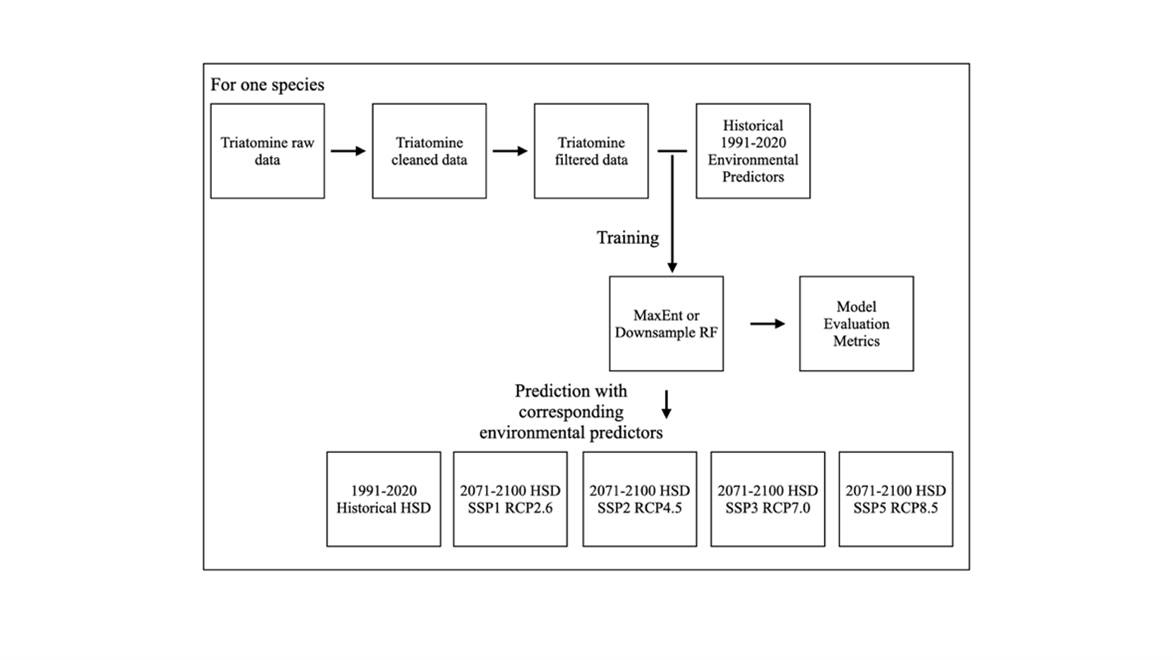
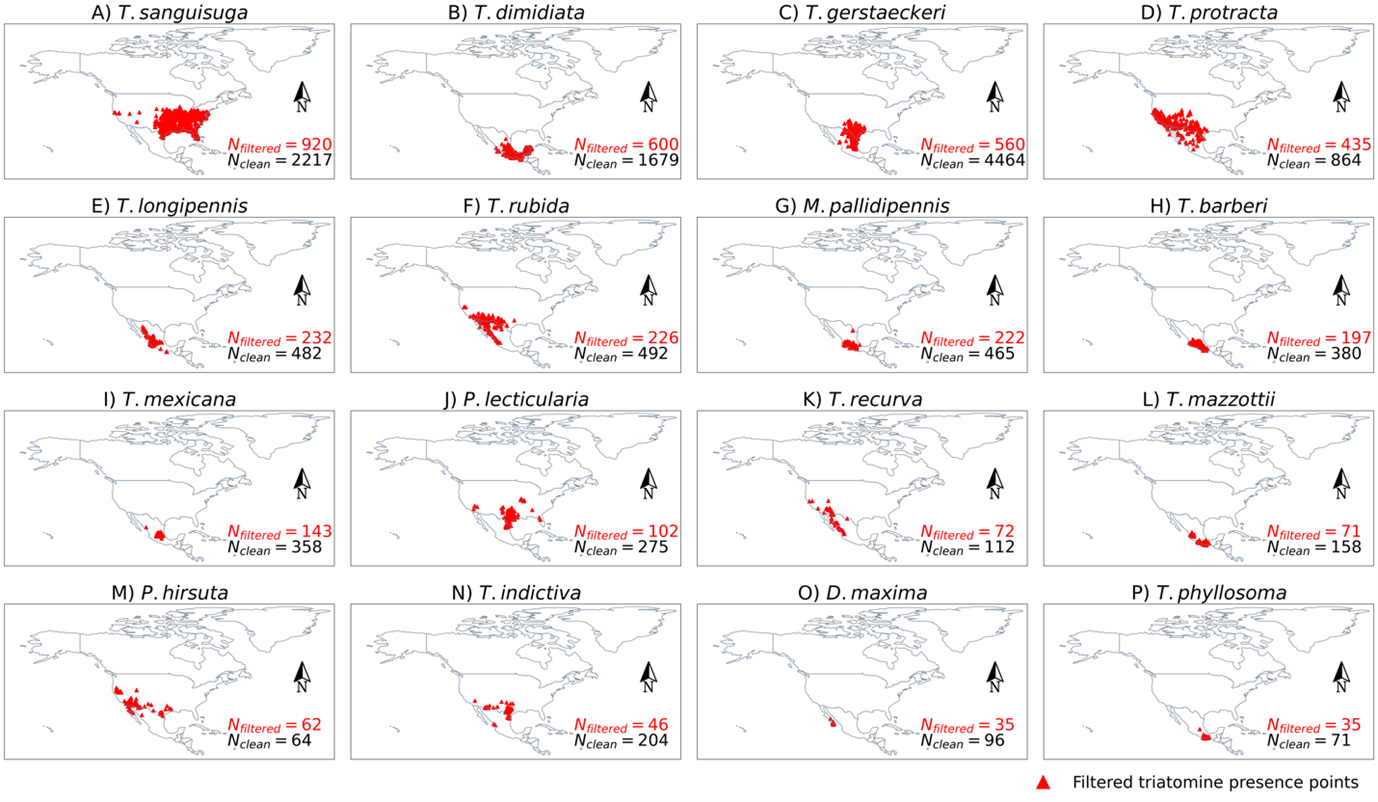
Triatomines (kissing bugs) are the primary vectors responsible for spreading the parasite *Trypanosoma cruzi* that cause Chagas disease. We present a new curated dataset of triatomine observations in the Americas containing 24,933 observations sourced from literature, citizen science, and new unpublished data. The entire dataset contains 127 species, of which 35 species are from North America and represent 62.0% of the data reported here. After cleaning and filtering, data from 14 species in North America were identified to have sufficient observations for calculating habitat suitability maps (HSMs) and projecting species distributions under different climate change scenarios. Our HSMs support the endemicity of Chagas Disease in the USA and the potential for spread into Canada towards the end of this century. This curated collection of triatomines and HSMs can assist in understanding potential exposure risks and guide ongoing screening strategies for Chagas disease in North America.